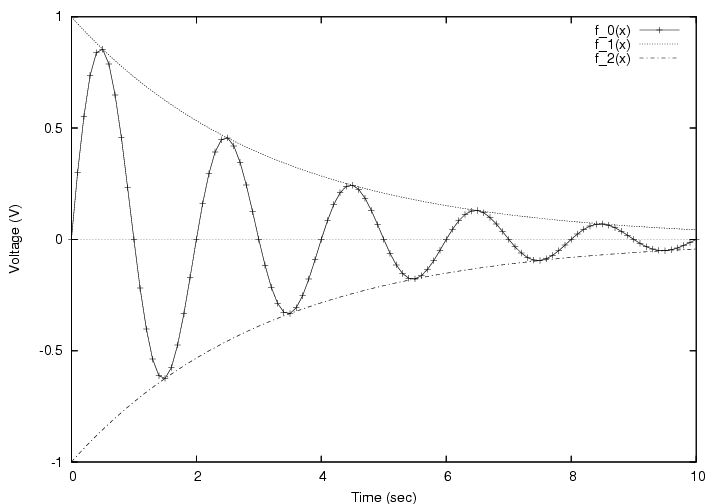
教科書 10.3.1 「gnuplotによるグラフの作成」と 10.4 の「gnuplot入門」をよく読んで gnuplot の基本操作を学んで下さい。
bash 3.00$ wget http://electra.kumst.kyoto-u.ac.jp/kougi/kisojoho/gnuplot2/sample1.dat
ファイルの中身を確認しておきましょう。データが3列あることを確認して下さい。
bash 3.00$ cat sample1.dat
bash 3.00$ gnuplot
gnuplot> plot "sample1.dat"
gnuplot> plot "sample1.dat" with linespoints
なお、次のように省略することもできます。
gnuplot> plot "sample1.dat" w lp
gnuplot> plot "sample1.dat" with lines
やはり、これも次のように省略できます
gnuplot> plot "sample1.dat" w l
gnuplot> plot "sample1.dat" with linespoints 2
線のスタイルが変わっていることを確認して下さい。 (画面上では色が変わります。1:赤,2:緑,3:青など。 ポストスクリプトファイルでは線の種類が変わります。 1:実線、2:破線、4:点線など。)
gnuplot> plot "sample1.dat" title "x^2" with linespoints 2
gnuplot> set key left
gnuplot> replot
gnuplot> plot "sample1.dat" using 1:3
gnuplot> plot "sample1.dat" using 1:3 title "x^2-10" with points 3
gnuplot> set xzeroaxis
gnuplot> replot
bash 3.00$ cat sample2.dat
空行でデータの集まりが区切られていることを確認して下さい。
gnuplot> splot "sample2.dat"
マウスの左クリックで視点(アングル)を変更することができます。 視点を変えてどのようにプロットされているか見てください。
gnuplot> splot "sample2.dat" with linespoint
gnuplotでは面は格子状に作られます。そのため、面を作成するためには "sample2.dat"のように空行で 区切られているデータの数をそろえる必要があります。 "sample2.dat"は5個ずつのデータに区切られています。
gnuplot> set hidden3d
gnuplot> replot
gnuplot> set terminal postscript eps
gnuplot> set output "sample2.eps"
gnuplot> replot
\documentclass[a4j]{jarticle}
\title{epsファイルを\LaTeX に貼り付ける練習}
\author{地球太郎 (9876543210)}
\date{\today}
\usepackage{graphicx}
\begin{document}
\maketitle
\begin{figure}[h]
\begin{center}
\includegraphics{sample2.eps}
\end{center}
\caption{$z=x^2+y^2$}
\end{figure}
\end{document}
コンパイルは platex を使います。
bash 3.00$ platex-utf8 file.texプレビューは xdvi を使います。
bash 3.00$ xdvi file.dvi &緑色の部分は自分で命名したファイル名を入れて下さい。
プリンタ出力の提出をもって出席とします。 出力できない者は口頭で申し出て下さい。 時間内にできなかった場合、来週の演習時間までに完成させて演習開始時に提出して下さい。
課題が終わってしまった人は、トライしましょう。 (提出すると課題点にボーナスがつきます)。 提出する際は氏名、学生番号を書いて課題とは別紙にして下さい。