例題 「 自己共分散関数および高速フーリエ変換(FFT) 」
- 解説 1: 自己共分散関数の推定
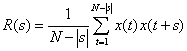
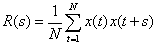
時系列データ x(t) の自己共分散関数 R(s) を求めるには,不偏な推定値をあたえる次式を用いる場合と,
- 例題プログラム 1: [ autocorr.m ]
次のプログラムは,ある信号 x (正弦波と正規乱数からなる時系列)の自己共分散関数を,MATLAB関数の
xcorrをつかって求め,プロットするプログラムである。
解説コメント入りのプログラムは, こちら%
% < Autocorrelation Function >
%
Fs = 200;
T = 1;
dt = 1/Fs;
N = T/dt;
t = (0:dt:T-dt);
%
% ----------------------signal---------------------------
rn = 0.7*randn(size(t));
x = sin(2*pi*4*t) + rn;
%
figure(1)
subplot(311); plot(x);
axis([0,2*N,-4,4]); legend('signal');
% ----------------------autocorrelation------------------
s = (-N+1:1:N-1);
w1 = xcorr(x,x,'unbiased');
subplot(312); plot(s,w1);
legend('autocorrelation (unbiased)');
w2 = xcorr(x,x,'biased');
subplot(313); plot(s,w2);
legend('autocorrelation (biased)');
% -------------------------------------------------------
- 解説 2: 高速フーリエ変換(FFT)
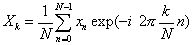
有限継続時間の離散時系列データ x(nΔt),n=1,・・・,N のフーリエ変換は,次式で与えられる。ただし一般には,1/N のない形が,離散フーリエ変換と定義されている。
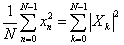
fftによって,これを計算することができる。元の時系列とフーリエ変換係数との間には,以下の関係が存在する。
- 例題プログラム 2: [ xfft.m ]
次のプログラムは,ある信号 x (2つの正弦波からなる時系列)の高速フーリエ変換を計算し,スペクトルを表示するプログラムである。なお,MATLAB関数
fftでは,上の式で 1/N しないままの係数が求められるようになっている。(こちらのほうが正式である。今の場合,パーセバルの式の意味がわかりやすいように,あえて 1/N している。)
解説コメント入りのプログラムは, こちら%
% < Fourier Tansform >
%
Fs = 200;
T = 1;
dt = 1/Fs;
N = T/dt;
t = (0:dt:T-dt);
%
% ----------------------signal---------------------------
x = cos(2*pi*10*t) + sin(2*pi*50*t);
figure(1)
subplot(411); plot(x); legend('signal');
%
% ----------------fast fourier tansform------------------
w = fft(x)/N;
subplot(412); plot(real(w));
legend('fourier coefficient (real)');
subplot(413); plot(imag(w));
legend('fourier coefficient (imagenary)');
subplot(414); plot(abs(w));
legend('fourier coefficient (absolute value)');
%
% ------------------Perseval theorem---------------------
pwrt = sum(x.^2)/N
pwrf = sum(abs(w).^2)
% -------------------------------------------------------
- 演習: 例題プログラムを実行してみよう
例題プログラムをコピーして実行してみよう。
- 与える信号をいろいろ工夫して,自己共分散関数や離散フーリエ変換についてよく理解してください。
- とくに,自己共分散関数やフーリエ変換の横軸の意味について考えてください。
- 例題2において,平均パワーが 1.0 になるのはなぜ?